 An interesting problem when analyzing Big Data is whether one should report the statistical significance of the estimated coefficients at the 1% level, instead of the more conventional 5% level. Intuitively a more conservative approach seems reasonable, but how do we decide exactly how conservative we ought to be?
It has been recognized for some time that when using large data it becomes “too easy” to reject the null hypothesis of no statistical significance, since confidence intervals are (Granger, 1998). The problem with a standard t-test in large samples is that it is replaced by its asymptotic form and the critical values are drawn from the Normal distribution. As a result, for large sample sizes the critical value for testing at the 95% significance level does not increase with the sample size. One possibility for addressing this problem is to let the critical value be a function of the sample size.
My colleague, Carlos Lamarche, at the University of Kentucky, pointed out this week that one can think about this as a testing problem for nested models. Cameron and Trivedi (2005) suggest using the Bayesian Information Criterion (BIC) for which the penalty increases with the sample size. Using the BIC for testing the significance of one variable is identical to using a two-sided t-test critical value of .
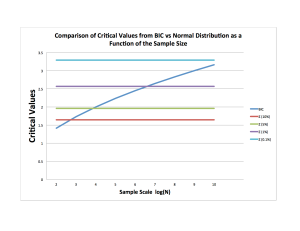
The plot shows how the critical value increases with the scale of the data and how this compares with the standard critical values for the t-test at different levels of significance. Using the BIC suggests using critical values greater than 2 for sample sizes larger than 1000. When using Big Data with over 1M observations, a critical value equivalent to a t-test at the 99% or even 99.9% seems advisable.
Granger, C. W. J. (1998): “Extracting information from mega-panels and high-frequency data,” Statistica Neerlandica, 52(3), 258–272.
Cameron, C. A., and P. K. Trivedi (2005): Microeconometrics: Methods and applications. New York, NY: Cambridge University Press.
Nice post, thanks! You may be interested in what I had to say on this topic back in 2011:
http://davegiles.blogspot.ca/2011/04/drawing-inferences-from-very-large-data.html
Hi, the issue is VERY relevant, congratulations to care about it. I’m nevertheless a bit surprised by the assumption that “The problem with a standard t-test in large samples is that it is replaced by its asymptotic form and the critical values are drawn from the Normal distribution. As a result, for large sample sizes the critical value for testing at the 95% significance level does not increase with the sample size.” -> in practice, I always use the Normal distribution, also for small numbers (n = ±20), as it is very near of the Student. The confidence limit intervals are therefore ±1.96 STDDEV/sqrt(n) (where STDDEV is the standard deviation of the variable of interest, STDDEV= nearly 0.5 for boolean variables if p is between 20 and 80%). The issue is not really with large values of n (sample size), but with large number of tests or tables : if you test 1e6 possible differences between subgroups, random noise will deliver 5e4 “significant” differences at the 95% level of confidence. Or did it understand wrongly the issue in your post? Best.
Big data flips inferential reasoning. Classical notions of hypothesis testing within a specification no longer compelling. Analogous reasoning wrt model selection the new wave. Will be fascinating!
I should clarify that in this post I was only looking at how to test for the significance of ONE variable. In Big Data we are also facing the additional problem of many errors when testing multiple hypotheses. There is a well-developed literature on false discovery rates which is very relevant for that case. More on this soon!