A Chat with Randall Lewis (Google) About “Big Data”

I had an opportunity to chat with Dr. Lewis about his research and Google. I did not record the interview, so this is not a standard “Q and A”.

The 5 questions I asked Dr. Lewis were broadly categorized into 3 groups: 2 questions about his research, 2 questions about working at Google, and 1 general question. I’ve done my best to paraphrase Dr. Lewis.


Measuring the Effects of Advertising

1. Getting more data can be both a blessing and a curse. Often, although one may add more of the “signal” we are interesting in measuring, we also add more “noise.” In your studies of online advertising, how does this “increasing” noise affect your ability to use traditional statistical tools, such as the “5% significance level?”

The challenge of online advertising is that the effect of advertising exists and is typically both economically large and statistically tiny. A model for a well run experiment of a profitable ad campaign may yield a partial R-squared value of about .000005 — what most economists would consider to be zero. Such a tiny R-squared implies that one needs a massive sample size (2+ million unique users) to acquire statistically significant estimates.

This is where being Yahoo or Google, firms whose ad platforms reach large numbers of users, have a clear advantage of scale. They can run massive experiments involving ten or hundreds of millions of users. But this leads to another, bigger problem: the Data Generating Process (DGP).

Collecting data is no longer very difficult or expensive for firms. Quantity is not a problem. But quality — how data is generated aka the DGP — remains a persistent problem.

This is captured best in the classic phrase “garbage in, garbage out.” There is no shortage of garbage data and the growth of garbage data is higher than that of quality data. Garbage data is easy to generate. Quality data is not. Quality data — data that is free of bias — requires randomization and meticulous care and maintenance of the DGP.

When searching for a tiny effect, like in Dr. Lewis’s online advertising research, understanding the DGP is paramount. Any bias that cannot be properly controlled in your model can devastate your estimates, especially in settings where both the treatment (advertising) and the outcome (purchases) are observed by both the researcher and any other systems (ad servers and other optimization algorithms). In these circumstances, worst case bias scenarios (i.e. users who are most likely to buy a product see ads for the product) are not uncommon.

Ideally, researchers want control over the entire DGP because this facilitates alignment between the DGP and the model. There is no room for a brute force approach when trying to find such a faint signal in so much noise. In the particular case of online advertising, the model must be perfectly aligned to fit the DGP or the estimates will be inconsistent.

A perfect model is fragile and inflexible. Dr. Lewis said that one should think of models in the online advertising world like particle accelerators. A particle accelerator is exactly designed to find a very specific signal from a carefully generated set of experimental data. Bias leaking into the DGP via misaligned systems is akin to an earthquake misaligning a particle accelerator. Both are too finely tuned to handle such disturbances — and the data will demonstrate the disturbances in both systems.

According to Dr. Lewis, one begins to appreciate the difficulty and challenge posed by “Big Data” problem like online advertising when one attempts to design a model that is 99% correctly aligned with the DGP. This a dauntingly difficult task. And even if one succeeds, the results can be hard to believe.

Like, for example, that online advertising in certain cases may have little effect on consumer behavior and may not be worth the money. Take, for example, the study by economists at eBay who found that biased analyses likely cost eBay well over $100M in ineffective advertising expenditures that were erroneously pitched as eBay’s most effective ad spending.

2. From your paper, it would appear folks in the advertising world do not share the obsession economists have with bias. For data folks out there unfamiliar with bias, why is it such a big problem and why can’t throwing more data in the mix solve the problem?

Selection bias is an ever-present problem for economists. Targeted advertising, for example, is an industry standard. However, measuring the success of an ad campaign is near impossible, no matter how much data you have, without randomization. And most online advertising firms are not randomly targeting consumers (that would defeat the “target” in “targeted” advertising). What we have then is an industry dependent on biased data; those who see ads are fundamentally different from those who do not.

Perhaps paying for targeted ads is a good strategy during an ad campaign. Perhaps the targeted ads are working. But unless data generated from targeted ad campaigns includes random assignment, then the data produced will, by construction, be plagued by selection bias. This, in turn, makes it impossible to do any sort of causal inference about the effectiveness of the ad campaign. And yet, that is exactly what many advertising firms tend to do — make unsubstantiated causal claims.


At Google

3. For economists a ‘big’ data set can be a few gigabytes in size. I’m assuming this is laughably small for someone at Google. What’s it like to do data analysis at Google and what tools/techniques do you use for handling and making sense of such truly massive amounts of data?

Dr. Lewis summed up working with “Big Data” at Google succinctly:

“Big Data in practice is just glorified computational accounting.”

Data is generally collected for some basic business tabulation to settle accounts. For example, large advertising companies collect data on clicks and ad impressions primarily for billing purposes.

Additional “Big Data” applications have been built on this primary business case for revenue optimization. “Big Data” is now a race to leverage the new granularity of such accounting data. Naturally, these new applications can influence what data is recorded thanks to the efficiency of computational tools.

“Big Data” is a storage challenge. Day to day, if any data is needed, it is never downloaded raw. It would be too big. Enormous data sets are instead refined before extraction into much smaller sets using software like SQL or Hadoop.

As for doing analysis, there are loads of tools to choose from but it is best to learn analytical software that facilitates sharing and collaboration. Don’t be the only person using R when your team is using Python.

4. (Matt’s question) What skills and educational background does it take to get a job doing data analysis at google?

In a somewhat order-of-importance, Dr. Lewis suggested the following programming skills:

Engineering — C/C++, Java, Python, Go, SQL.
Quantitative Analysts (Data Scientists) — Python (SciPy/NumPy/Pandas), Linux/Bash/Core Utilities expertise, SQL, R (open-source), Matlab/Julia/Octave, Stata/SAS/SPSS (and other less broadly used languages).


General

5. What are your feelings about the mainstream explosion of the term “Big Data”?

Dr. Lewis is glad the term exists and that people are thinking about it, but he wants people to get real about it in the world of causal inference (“econinformatics”). For describing data (summary stats, etc.), “Big Data” has been great. For finding pockets of statistically informative and clean causality in data, “Big Data” has also been great. But “Big Data” in practice is more about arbitrarily precise correlations that tell us little about what most decision-makers care about: the causal effects.
A Chat with Randall Lewis (Google) About “Big Data”

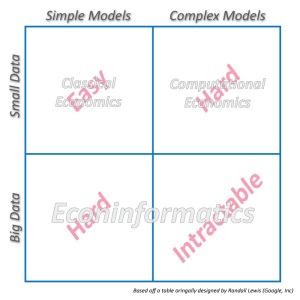
Big Data Requires a New Kind of Expert: The Econinformatrician

 Simple Models + Big Data = Econinformatics

Economics Theory + Big Data = Econinformatics

I recently had the opportunity to attend a conference held in honor of the great econometrician Dr. Jerry Hausman. The event, hosted by the Wang Yanan Institute for Studies in Economics (WISE) at Xiamen University, focused on recent developments in econometric theory with applications. The one notable presentation was by Google’s Dr. Randall Lewis.

In his presentation, Dr. Lewis gave a practitioner’s overview about what it really means to work with Big Data. As a Google employee, it seemed to the audience that he was uniquely qualified to discuss the day to day troubles that come with analyzing petabytes of data. He instead started with a story about his first day as a Yahoo intern in 2008.

He had a problem. He needed to open a 2GB text file and had no idea how. He tried Notepad — it didn’t work. He tried importing it to Matlab — his computer couldn’t handle it. He exhausted every method he had used in the past to view or load data. All failed, and several days passed before he finally managed to open the file.

Like most economics Ph.D.s, Dr. Lewis’ education focused almost entirely on theory, but unlike most economics Ph.D.s, his internship gave him the opportunity to battle against large text files. He learned simple technical skills he wasn’t learning in his doctoral program, which ultimately allowed him to do his dissertation using data inaccessible to his colleagues.

He later told me that he wishes more Ph.D. students could have the same opportunities that he did. He was lucky and benefitted greatly from the practical parts of his education — they helped him finish his Ph.D. in just four years.

Econometric theory is inarguably important, as one cannot do proper causal inference without it. And as Dr. Lewis explained, causal inference is what separates economists from “data scientists”. Unfortunately for the economist, econometric theory doesn’t explain how to open a large text file via Unix command line.

Working with Big Data is cumbersome. Simple tasks, like opening or loading files, become complicated. Dr. Lewis explained that computer science and engineering students may finish school with the skills to deal with large data files, but many (if not most) students of economics do not. The simple models they learned to run as young econometricians also stop being so simple when performed on Big Data. “I just have to highlight that, in almost everything I do, it’s actually embarrassingly trivial, econometrically,” said Dr. Lewis during his talk. “I’m trying to work towards doing more advanced things, but you end up running into scalability constraints.”

Constraints are why the simple becomes difficult when doing economic analyses with Big Data. Hardware, computational power, time, funds, scalability, knowledge, etc. are all constrained, posing major challenges to the econometrician. When running a basic linear regression can cost you tens of thousands of dollars in electricity consumption, attempting a more computationally complex model just isn’t feasible.

If Big Data is the future of applied econometrics, then a strong background in econometric theory, while necessary, will no longer be sufficient for young econometricians looking to find work. They will also require the technical know-how to deal with terabytes of data. This combination is rare enough that Dr. Lewis has coined a term for what he does: Econinformatics.”

Half computer scientist, half economist. The Econinformatrician.


One final note. I wanted to highlight an interaction that occurred during Dr. Lewis’s presentation:

Dr. Lewis to the audience — “Who here, if I were to give you a 200GB gzipped file, could tell me how to read the first 3 lines of that file?”

One person (yours truly) rose their hand. There were roughly 110 people in the audience.

A professor from the audience — “With help from my RA, yes.”

[Audience laughs]

I’m sure Dr. Hausman will be fine without knowing how to read the first 3 lines of a 200 GB file. Personally, once I got back from China, I immediately began teaching myself more Unix command line and some SQL.


Big Data Requires a New Kind of Expert: The Econinformatrician

Big Data, Nutrition, and Food Taxes

A recent Huffington Post article discusses one of my papers with Michael Lovenheim at Cornell University. In this paper we analyze a series of unique Big Data sources tracking over 123 million food purchases over the period 2002-2007 in order to create a detailed model of food demand in the US. Understanding food demand  is important as obesity is a major public health concern world wide. Obesity kills more than 2.8 million people every year, according to the WHO. Today, over 2/3 of Americans are overweight and over 36% are obese. Estimates also suggest that about 30% of children are obese or overweight. The increases in obesity have been more pronounced among those with lower income, especially for women, as well as among non-Asian minorities. Obesity has been linked to a higher prevalence of chronic diseases, such as arthritis, diabetes and cardiovascular disease and the associated cost to the U.S. medical system has been estimated at about $147 billion per year, with Medicare and Medicaid financing approximately half such costs.

Using Big Data we simulate the role of product taxes on soda, sugar-sweetened beverages, packaged meals, and snacks, and nutrient taxes on fat, salt, and sugar. We find that nutrient taxes (e.g. on sugar) has a significantly larger impact on nutrition than an equivalent product tax (e.g. a soda tax), due to the fact that nutrient taxes are broader-based taxes. However, the costs of these taxes in terms of consumer utility are not higher. A sugar tax in particular is a powerful tool to induce healthier nutritive bundles among consumers, and appears to be more effective than other product or nutrient taxes.

Harding, M. and Lovenheim, M. (2013) “The Effect of Prices on Nutrition: Comparing the Impact of Product- and Nutrient-Specific Taxes”, NBER WP 19781.

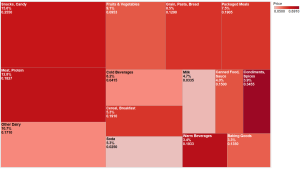
Graphical representation of food expenditures on the 14 major product categories in the sample.

Graphical representation of food expenditures on the 14 major product categories for US households.

The size of the squares is proportional to the budget share of the corresponding product. The budget share is given in % under each product category name. The color shading of each rectangle corresponds to the price per ounce of products in each of the categories. The price per ounce in $ is also reported under the budget share for each category.

Big Data, Nutrition, and Food Taxes

Statistical significance in Big Data

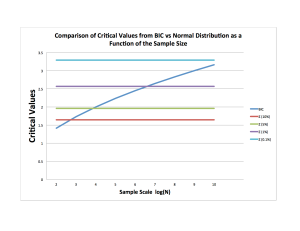
Critical Values and Sample SizesAn interesting problem when analyzing Big Data is whether one should report the statistical significance of the estimated coefficients at the 1% level, instead of the more conventional 5% level. Intuitively a more conservative approach seems reasonable, but how do we decide exactly how conservative we ought to be?

It has been recognized for some time that when using large data it becomes “too easy” to reject the null hypothesis of no statistical significance, since confidence intervals are O(N^{-1})  (Granger, 1998). The problem with a standard t-test in large samples is that it is replaced by its asymptotic form and the critical values are drawn from the Normal distribution. As a result, for large sample sizes the critical value for testing at the 95% significance level does not increase with the sample size. One possibility for addressing this problem is to let the critical value be a function of the sample size.

My colleague, Carlos Lamarche, at the University of Kentucky, pointed out this week that one can think about this as a testing problem for nested models. Cameron and Trivedi (2005) suggest using the Bayesian Information Criterion (BIC) for which the penalty increases with the sample size. Using the BIC for testing the significance of one variable is identical to using a two-sided t-test critical value of \sqrt{ln(N)}.

The plot shows how the critical value increases with the scale of the data and how this compares with the standard critical values for the t-test at different levels of significance. Using the BIC suggests using critical values greater than 2 for sample sizes larger than 1000. When using Big Data with over 1M observations, a critical value equivalent to a t-test at the 99% or even 99.9% seems advisable.

Granger, C. W. J. (1998): “Extracting information from mega-panels and high-frequency data,” Statistica Neerlandica, 52(3), 258–272.

Cameron, C. A., and P. K. Trivedi (2005): Microeconometrics: Methods and applications. New York, NY: Cambridge University Press.

Statistical significance in Big Data

Big Data and Small Children

In a recent paper, Janet Currie, a Professor at Princeton University asks whether privacy concerns may not be responsible for missed opportunities in pediatrics research. Economists have emphasized for a long time the importance of early childhood interventions that can lead to a significant lifetime benefit. Big Data research on children is not easy to conduct because detailed administrative records are often unavailable to researchers. For example detailed birth certificates with precise information on infants and mothers are collected but generally not made available to qualified researchers. The trend in recent years has been to eliminate the access that was previously granted in some states such as Texas. While there are valid privacy questions and interesting ethical questions related to consent, I agree that it is a missed opportunity. Since much of this data is only available in aggregate form for large counties, it makes it difficult to draw causal inference about the drivers of infant and children outcomes. Data from third-party aggregators such as Acxiom is fairly accurate at the household level, but offers limited insights about the children in the household. This impedes much valuable public health research. In a recent SIEPR policy brief I look at the impact of drinking water contaminants on infant health using county level data and find significant impacts on birth weight and APGAR scores for a number of contaminants. Given the geographic spread of contaminated drinking water it would be very insightful to do this analysis by using the precise geographic location of each mother in order to measure her exposure. This is not possible today and we are missing out on an opportunity to precisely quantify the social cost of not enforcing environmental regulations.

Acute total coliform contamination 2002-2006
Big Data and Small Children

Theory vs Measurement

Francis Diebold, Professor of Economics and Statistics at the University of Pennsylvania, challenges us in his 60-second lecture to consider that: “[…] theory gets too much respect, and measurement doesn’t get enough. Perhaps that will change in the emerging age of Big Data.”

Will we succeed in using Economics to transform Big Data Analytics, so it becomes less of a data mining technique and more of an Econometric tool?

Video